This document describes and shows all diagram types provided by Asciidoctor Diagram.

1. Introduction and goals

This document should give an overview over all supported diagram types provided by Asciidoctor Diagram[DIAG].

2. ASCIIToSVG

ASCIIToSVG parses ASCII art diagrams, attempting to convert them to an aesthetically pleasing SVG output.

— ASCIIToSVG
https://github.com/asciitosvg/asciitosvg

2.1. Internal diagram source

ascii2svg internal example diagram

2.2. External diagram source file

Diagram

3. Barcodes

The barcode extension provides barcode rendering. Barcode macros can be specified using blocks, inline macros or block macros.

— Asciidoctor Diagrams
https://docs.asciidoctor.org/diagram-extension/latest/#barcode

3.1. bookland (ISBN)

Diagram

3.2. codabar

Diagram

3.3. code25

Diagram

3.4. code25iata

Diagram

3.5. code25interleaved

Diagram

3.6. code39

Diagram

3.7. code93

Diagram

3.8. code128

Diagram

3.9. code128a

Diagram

3.10. code128b

Diagram

3.11. code128c

Diagram

3.12. ean8

Diagram

3.13. ean13

Diagram

3.14. gs1_128

No valid data because of <FNC1>.

3.15. qrcode

Diagram

3.16. upca

Diagram

4. Blockdiag

blockdiag and its family generate diagram images from simple text files.

— Takeshi KOMIYA
http://blockdiag.com/en/index.html

blockdiag supports many types of diagrams like

All these tools layouts diagram elements automatically and generates beautiful diagram images from simple text format (similar to graphviz’s DOT format).

4.1. actdiag

actdiag is a simple activity-diagram image generator and generates activity-diagram images from .diag files (similar to graphviz’s DOT files).

— Takeshi KOMIYA
http://blockdiag.com/en/actdiag/index.html

4.1.1. Internal diagram source

actdiag internal example diagram

4.1.2. External diagram source file

Diagram

4.2. blockdiag

blockdiag generates block-diagram images from .diag files (similar to graphviz’s DOT files).

— Takeshi KOMIYA
http://blockdiag.com/en/blockdiag/index.html

4.2.1. Internal diagram source

blockdiag internal example diagram

4.2.2. External diagram source file

Diagram

4.3. nwdiag

nwdiag generates network-diagram images from .diag files (similar to graphviz’s DOT files).

— Takeshi KOMIYA
http://blockdiag.com/en/nwdiag/index.html

4.3.1. Internal diagram source

nwdiag internal example diagram

And, nwdiag package includes more scripts called rackdiag and packetdiag.

4.3.2. rackdiag

rackdiag generates rack-structure diagram images:

nwdiag rackdiag internal example diagram

4.3.3. packetdiag

packetdiag generates packet header diagram images:

nwdiag packetdiag internal example diagram

4.3.4. External diagram source file

Diagram

4.4. seqdiag

seqdiag generates sequence-diagram images from .diag files (similar to graphviz’s DOT files).

— Takeshi KOMIYA
http://blockdiag.com/en/seqdiag/index.html

4.4.1. Internal diagram source

seqdiag internal example diagram

4.4.2. External diagram source file

Diagram

5. BPMN

BPMN everywhere, for everyone

Create, embed and extend BPMN diagrams.

— bpmn.io
https://bpmn.io/toolkit/bpmn-js/

5.1. Internal diagram source

bpmn internal example diagram

5.2. External diagram source file

Diagram

6. Bytefield

Generating byte field diagrams.

— bytefield
https://github.com/Deep-Symmetry/bytefield-svg

6.1. Internal diagram source

bytefield internal example diagram

6.2. External diagram source file

Diagram

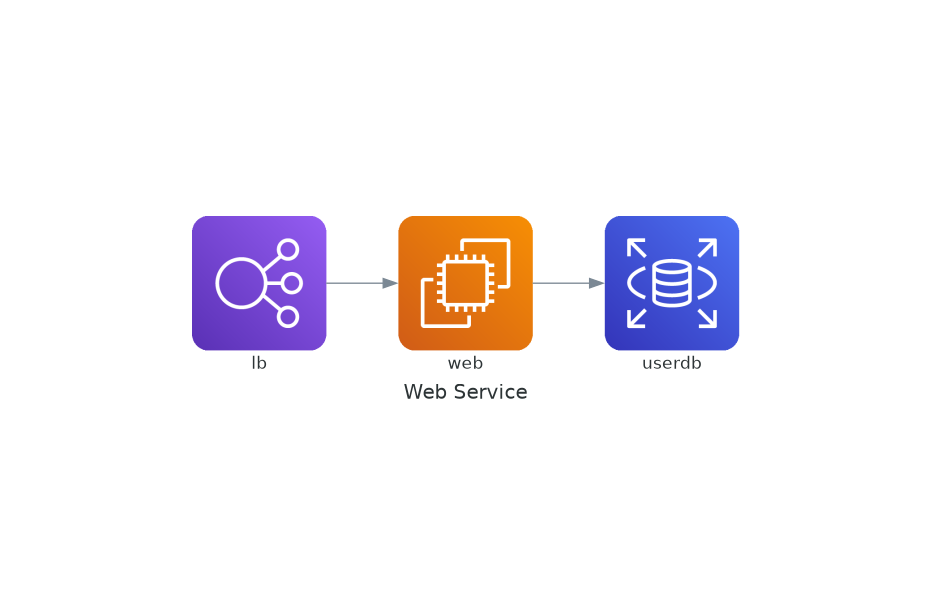
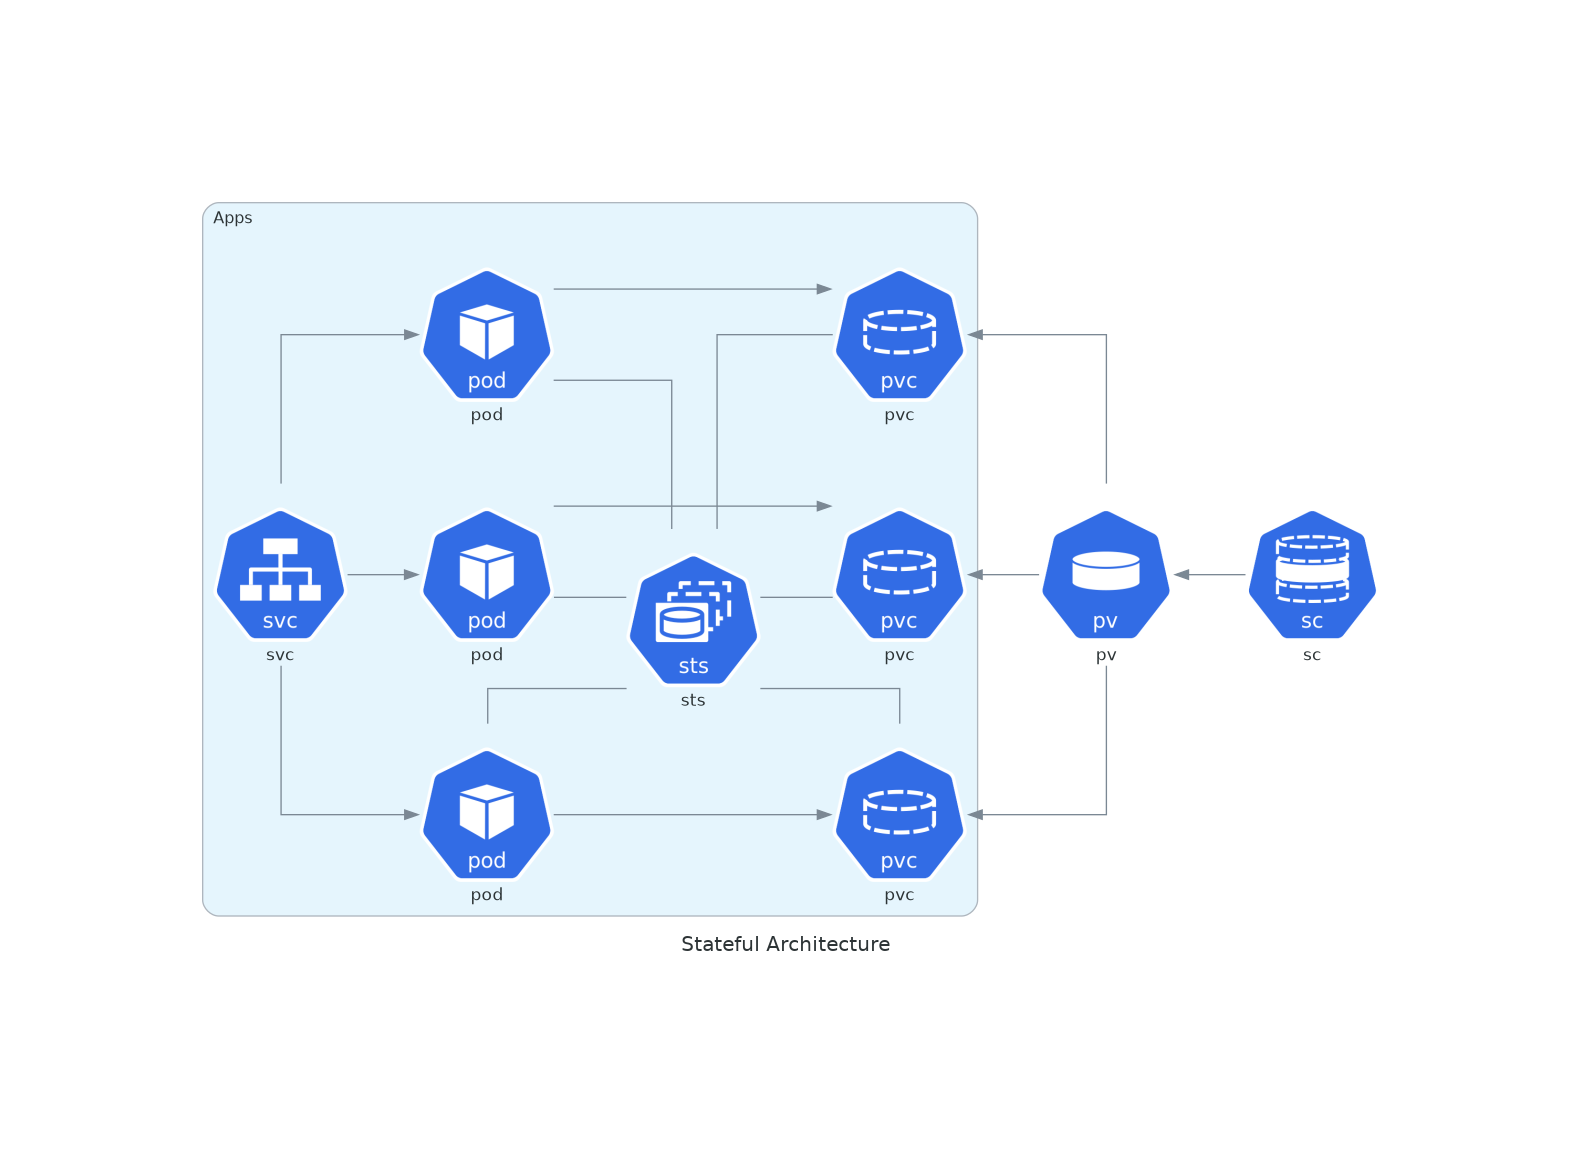
7. Diagrams as (Python) Code

Diagrams — Diagram as Code

Diagrams lets you draw the cloud system architecture in Python code.

It was born for prototyping a new system architecture without any design tools. You can also describe or visualize the existing system architecture as well.

— Diagrams
https://diagrams.mingrammer.com/

7.1. Internal diagram source

diagrams internal example diagram

7.2. External diagram source file

Diagram

8. Ditaa

Ditaa is a small command-line utility written in Java, that can convert diagrams drawn using ascii art into proper bitmap graphics.

— ditaa
http://ditaa.sourceforge.net/

8.1. Internal diagram source

ditaa internal example diagram

8.2. External diagram source file

Diagram

9. Dpic

Dpic is an implementation of the pic "little language" for creating line drawings and illustrations for documents, web pages, and other uses.

— J. D. Aplevich
https://gitlab.com/aplevich/dpic

9.1. Internal diagram source

dpic internal example diagram

9.2. External diagram source file

Diagram

10. ERD

Translates a plain text description of a relational database schema to a graphical entity-relationship diagram.

— erd
https://github.com/kaishuu0123/erd-go

10.1. Internal diagram source

erd internal example diagram

10.2. External diagram source file

Diagram

11. Gnuplot

Gnuplot is a portable command-line driven graphing utility originally created to allow scientists and students to visualize mathematical functions and data interactively, but has grown to support many non-interactive uses such as web scripting.

— Gnuplot
http://gnuplot.info/

11.1. Internal diagram source

gnuplot internal example diagram

11.2. External diagram source file

Diagram

12. graphviz

Graphviz is open source graph visualization software. Graph visualization is a way of representing structural information as diagrams of abstract graphs and networks. It has important applications in networking, bioinformatics, software engineering, database and web design, machine learning, and in visual interfaces for other technical domains.

— graphviz
https://graphviz.gitlab.io/

12.1. Internal diagram source

graphviz internal example diagram

12.2. External diagram source file

Diagram

13. meme

Diagram

14. mermaid

14.1. Internal diagram source

mermaid internal example diagram

14.2. External diagram source file

Diagram

15. mscgen

Mscgen is a small program that parses Message Sequence Chart descriptions and produces PNG, SVG, EPS or server side image maps (ismaps) as the output. Message Sequence Charts (MSCs) are a way of representing entities and interactions over some time period and are often used in combination with SDL.

— mscgen
http://www.mcternan.me.uk/mscgen/

15.1. Internal diagram source

The mscgen backend is currently not supported.

15.2. External diagram source file

The mscgen backend is currently not supported.

16. Nomnoml

Nomnoml is a tool for drawing UML diagrams based on a simple syntax. It tries to keep its syntax visually as close as possible to the generated UML diagram without resorting to ASCII drawings.

— Daniel Kallin
https://github.com/skanaar/nomnoml

16.1. Internal diagram source

nomnoml internal example diagram

16.2. External diagram source file

Diagram

17. Pikchr

Pikchr (pronounced "picture") is a PIC-like markup language for diagrams in technical documentation. Pikchr is designed to be embedded in fenced code blocks of Markdown or similar mechanisms of other documentation markup languages.

— Pikchr
https://pikchr.org/home/doc/trunk/homepage.md

17.1. Internal diagram source

pikchr internal example diagram

17.2. External diagram source file

Diagram

18. PlantUML

PlantUML is a component that allows to quickly write :

  • Sequence diagram

  • Usecase diagram

  • Class diagram

  • Activity diagram (here is the legacy syntax)

  • Component diagram

  • State diagram

  • Object diagram

  • Deployment diagram

  • Timing diagram

The following non-UML diagrams are also supported:

  • Network

  • Wireframe graphical interface

  • Archimate diagram

  • Specification and Description Language (SDL)

  • Ditaa diagram

  • Gantt diagram

  • MindMap diagram

  • Work Breakdown Structure diagram

  • Mathematic with AsciiMath or JLaTeXMath notation

  • Entity Relationship diagram

Diagrams are defined using a simple and intuitive language.

— PlantUML
https://plantuml.com/

18.1. PlantUML

18.1.1. Internal diagram source

plantuml plantuml internal example diagram

18.1.2. External diagram source file

Diagram

18.2. Salt

Salt is a subproject included in PlantUML that may help you to design graphical interface.

— PlantUML
https://plantuml.com/salt

18.2.1. Internal diagram source

plantuml salt internal example diagram

18.2.2. External diagram source file

Diagram

19. state-machine-cat (smcat)

State Machine cat

write beautiful state charts

— Sander Verweij
https://github.com/sverweij/state-machine-cat

19.1. Internal diagram source

smcat internal example diagram

19.2. External diagram source file

Diagram

20. Svgbob

Svgbob can create a nice graphical representation of your text diagrams.

— Jovansonlee Cesar
https://github.com/ivanceras/svgbob/

20.1. Internal diagram source

smcat internal example diagram

20.2. External diagram source file

Diagram

21. Symbolator

Symbolator is a component diagramming tool for VHDL and Verilog. It will parse HDL source files, extract components or modules and render them as an image.

— Kevin Thibedeau
https://kevinpt.github.io/symbolator

21.1. Internal diagram source

symbolator internal example diagram

21.2. External diagram source file

Diagram

22. Syntrax

Syntrax is a railroad diagram generator. It creates a visual illustration of the grammar used for programming languages.

— Kevin Thibedeau
https://kevinpt.github.io/syntrax

22.1. Internal diagram source

syntrax internal example diagram

22.2. External diagram source file

Diagram

23. Tikz

“What is TikZ?”

Basically, it just defines a number of TEX commands that draw graphics.

— Till Tantau
https://pgf-tikz.github.io/pgf/pgfmanual.pdf

23.1. Internal diagram source

tikz internal example diagram

23.2. External diagram source file

Diagram

24. UMLet

UMLet is a free, open-source UML tool with a simple user interface: draw UML diagrams fast, create sequence and activity diagrams from plain text, share via exports to eps, pdf, jpg, svg, and clipboard, and develop new, custom UML elements.

— The UMLet Team
https://www.umlet.com

24.1. Internal diagram source

The umlet backend currently does not support internal diagram sources.

24.2. External diagram source file

Diagram

25. Vega Lite

Vega-Lite is a high-level grammar of interactive graphics. It provides a concise, declarative JSON syntax to create an expressive range of visualizations for data analysis and presentation.

— Vega
https://vega.github.io/vega-lite/

25.1. Internal diagram source

vegalite internal example diagram

25.2. External diagram source file

Diagram

26. Vega

Vega is a visualization grammar, a declarative language for creating, saving, and sharing interactive visualization designs. With Vega, you can describe the visual appearance and interactive behavior of a visualization in a JSON format, and generate web-based views using Canvas or SVG.

— Vega
https://vega.github.io/vega/

26.1. Internal diagram source

vega internal example diagram

26.2. External diagram source file

Diagram

27. WaveDrom

WaveDrom draws your Timing Diagram or Waveform from simple textual description.

— WaveDrom
https://wavedrom.com/

27.1. Internal diagram source

wavedrom internal example diagram

27.2. External diagram source file

Diagram

Bibliography